8 Outputs
8.3 Graphs
8.3.3 Bar graphs
Loading libraries and the main dataset
library(tidyverse)
library(ggplot2)
library(plotly)
library(openxlsx)
library(data.table)
library(reshape)

main_dataset <- read.csv("inputs/UKR2007_MSNA20_HH_dataset_main_rcop.csv", na.strings = "")
Choosing the needed indicator for building bar graph. The indicators in the questionnaire could be in 2 types: Only one answer can be selected (select_one question) and multiple answers can be selected (select_multiple question). Will review it separately.
- For select one questions:
Preparing values for visualization (replacing xml values to lables)
# Loading questionnaire
questions <- read.xlsx("inputs/UKR2007_MSNA20_HH_Questionnaire_24JUL2020.xlsx", sheet = "survey", na.strings = "")
choices <- read.xlsx("inputs/UKR2007_MSNA20_HH_Questionnaire_24JUL2020.xlsx", sheet = "choices", na.strings = "")

# Based on value we get option type
q.list_name <- str_split(questions[questions$name == "b9_hohh_marital_status" & !is.na(questions$name), "type"], " ")[[1]][2]

# New table with xml and labels
labels <- choices %>%
  filter(list_name == q.list_name) %>%
  select(name, "label::English") %>%
  dplyr::rename(b9_hohh_marital_status = name, b9_hohh_marital_status_label = "label::English")

# Add a column with English labels to the main dataset
main_dataset <- merge(labels, main_dataset, by = 'b9_hohh_marital_status')
Building a bar graph
ggplot((main_dataset %>%
          filter(!is.na(b9_hohh_marital_status_label)) %>%
          dplyr::group_by(b9_hohh_marital_status_label) %>%
          dplyr::summarize(weight_sum = round(sum(stratum.weight), 2))), aes(y = reorder(b9_hohh_marital_status_label, weight_sum), x = weight_sum/sum(weight_sum))) +
  geom_bar(stat = "identity", fill = "#EE5859") +
  geom_text(aes(label = paste(round((weight_sum/sum(weight_sum)*100),0),"%")), color = "#58585A", size = 4, hjust = -0.1) +
  scale_x_continuous(labels = scales::percent) +
  theme(axis.title.x = element_blank(), axis.text.x = element_blank(), axis.ticks.x = element_blank(), axis.title.y = element_blank(), axis.ticks.y = element_blank(), axis.text.y = element_text(color = "#58585A", size = 12),
  panel.grid.major = element_blank(), panel.grid.minor = element_blank(), panel.background = element_blank())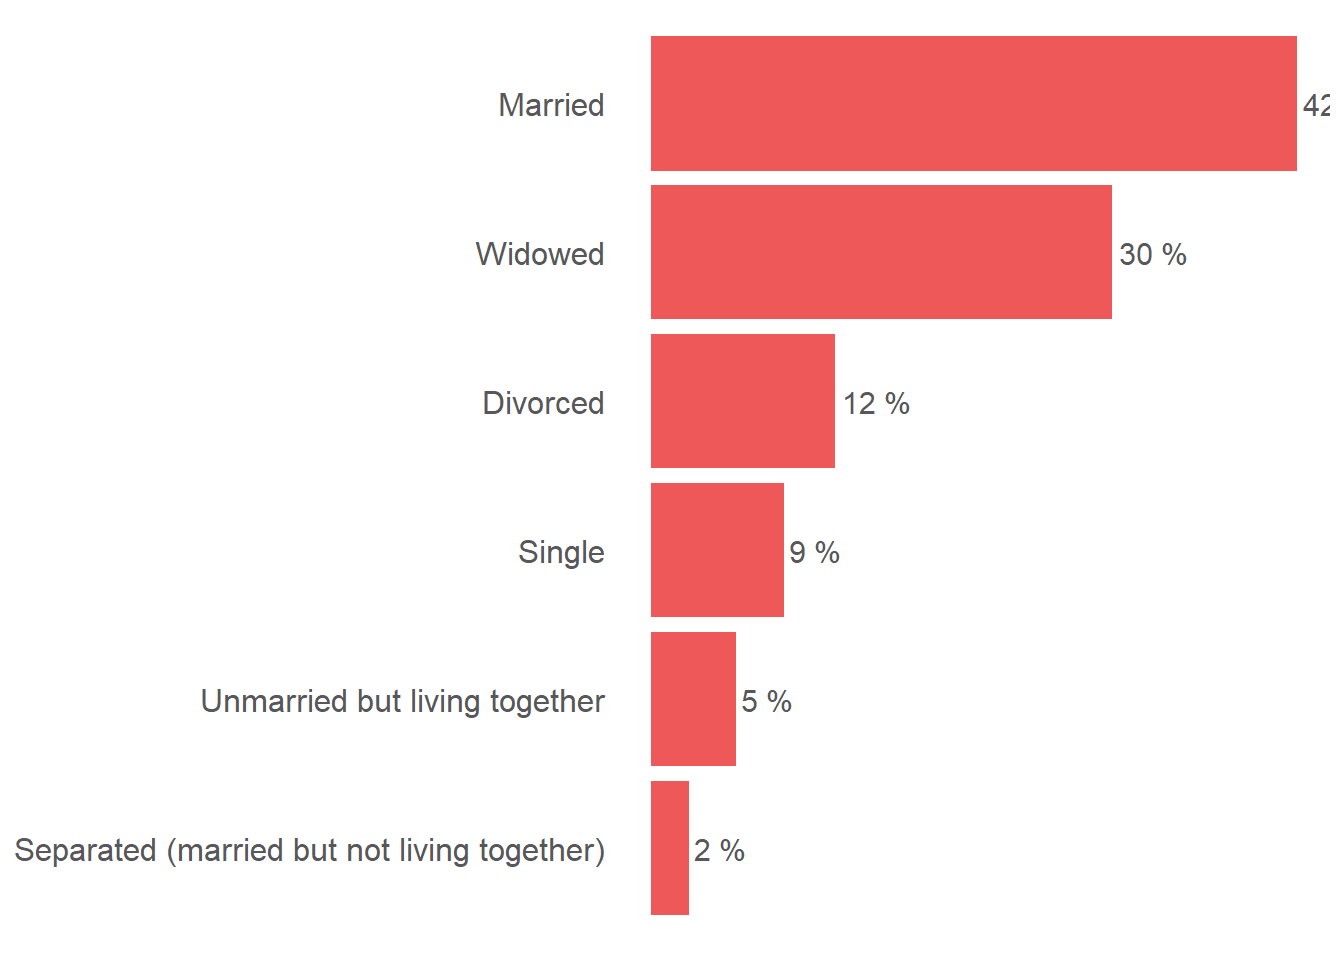
Removing temporary data
- For select multiple questions:
Preparing values for visualization (replacing xml values to lables; calculating results)
# Getting needed columns from the main dataset (indicator and weight)
visual_dataset <- main_dataset[,grepl("b10_hohh_vulnerability.|stratum.weight", names(main_dataset))]

# Reshaping the dataset
visual_dataset <- melt(visual_dataset, id.vars = "stratum.weight")

# Grouping by choices and getting sum of weights
visual_dataset <- visual_dataset %>%
  mutate(weight = stratum.weight * value) %>%
  group_by(variable) %>%
  summarise(weight_sum = sum(as.numeric(weight))) %>%
  mutate(percentage = round(weight_sum / sum(main_dataset$stratum.weight)*100)) %>%
  dplyr::rename(b10_hohh_vulnerability = variable)

# Based on value we get option type and replacing xmls to the labels and
q.list_name <- str_split(questions[questions$name == "b10_hohh_vulnerability" & !is.na(questions$name), "type"], " ")[[1]][2]

# New table with xml and labels
labels <- choices %>%
  filter(list_name == q.list_name) %>%
  select(name, "label::English") %>%
  dplyr::rename(b10_hohh_vulnerability = name, b10_hohh_vulnerability_label = "label::English") %>%
  mutate(b10_hohh_vulnerability = paste0("b10_hohh_vulnerability.", b10_hohh_vulnerability))

# Add a column with English labels to the visualization dataset
visual_dataset <- merge(labels, visual_dataset, by = 'b10_hohh_vulnerability')
Building a bar graph
ggplot(visual_dataset, aes(y = reorder(b10_hohh_vulnerability_label, percentage), x = percentage)) +
  geom_bar(stat = "identity", fill = "#EE5859") +
  geom_text(aes(label = paste(percentage, "%")), color = "#58585A", size = 4, hjust = -0.1) +
  scale_x_continuous(labels = scales::percent) +
  theme(axis.title.x = element_blank(), axis.text.x = element_blank(), axis.ticks.x = element_blank(), axis.title.y = element_blank(), axis.ticks.y = element_blank(), axis.text.y = element_text(color = "#58585A", size = 12),
  panel.grid.major = element_blank(), panel.grid.minor = element_blank(), panel.background = element_blank())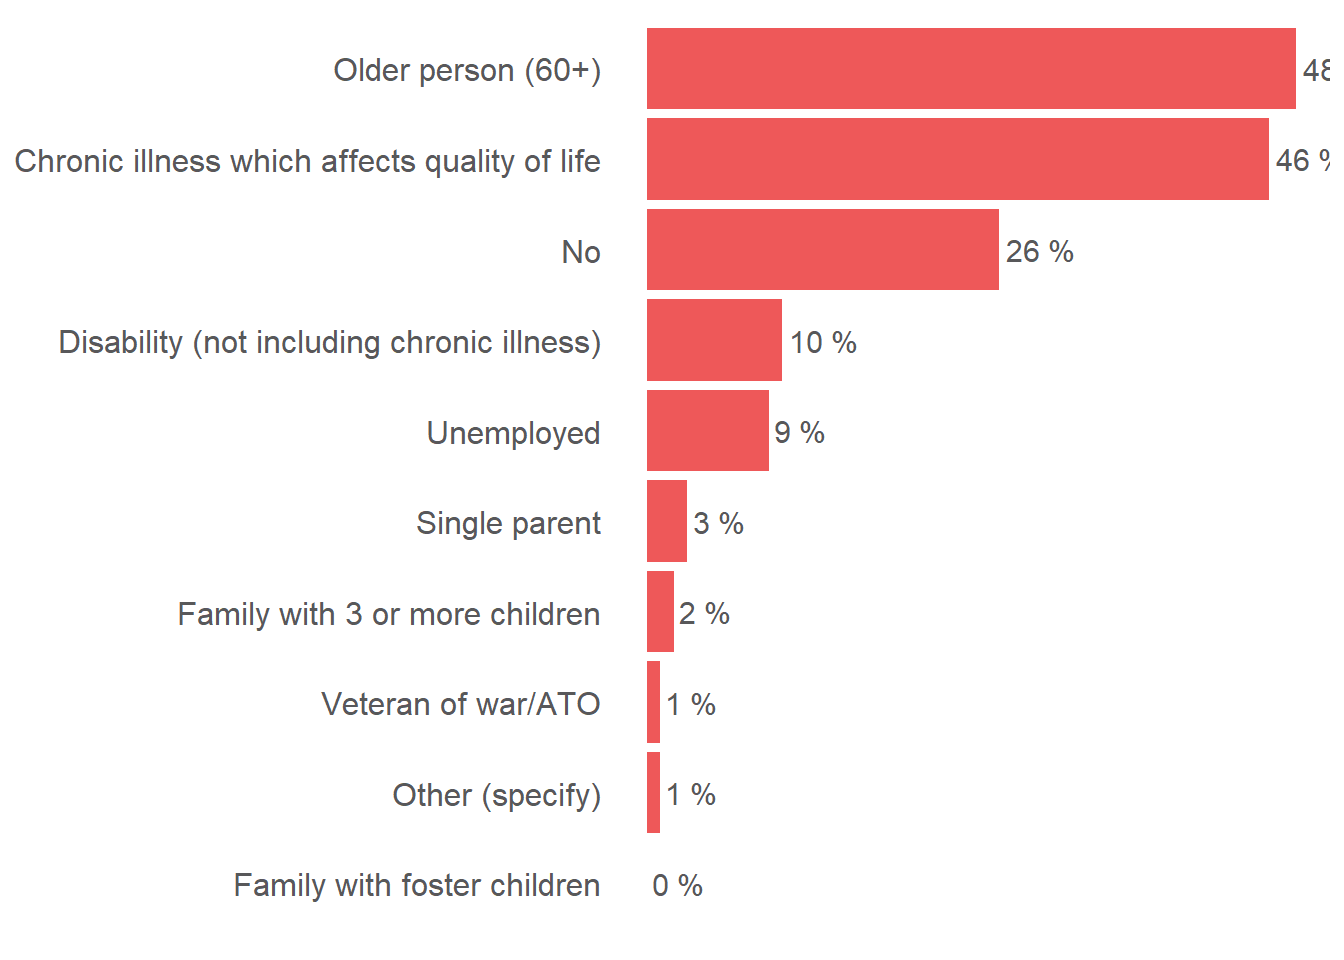
Removing temporary data
8.3.4 Euler diagram
An Euler diagram is a diagrammatic means of representing sets and their relationships. They are particularly useful for explaining complex hierarchies and overlapping definitions. They are similar to another set diagramming technique, Venn diagrams. Unlike Venn diagrams, which show all possible relations between different sets, the Euler diagram shows only relevant relationships. Source
First let’s load Eulerr library and our dataset
Euler diagrams are particularly useful to visualize overlaps between HH characteristics that help better understand the demographic profile of the area. For example, let’s visualize overlaps between such HH characteristics as age, displacement status, income level, disability, and employment status.
library(eulerr)
library(magrittr)
library(dplyr)
library(tidyr)
library(purrr)
library(stringr)
library(tibble)
library(UpSetR)

vulnerability_data <- main_dataset %>%
    select(b10_hohh_vulnerability.disability_not_including_chronic_illness,b10_hohh_vulnerability.older_person,
           b10_hohh_vulnerability.unemployed,d1_hh_displacement_status,b15_hohh_income,X_uuid, strata, stratum.weight)%>%
  #select all necessary columns
    mutate(displaced = ifelse(d1_hh_displacement_status == "no", 0, 1),
           low_income = ifelse(as.numeric(b15_hohh_income) >= 2189, 0, 1))%>% #2189 UAH(83$) is minimal monthly income in 2020
  #calculate binary indicators in case they are not available in the dataset directly from select multiple questions
    select(-d1_hh_displacement_status, -b15_hohh_income)%>%
    setNames(c("disability", "60+", "unemployed", "uuid", "strata", "weight", "displaced", "low_income"))
  #remove unnecessary columns and rename other column

vulnerability_data <- #create column that will combine all binary columns into one (same approach as in ### Re-generate text                             column  for select multiple questions section of Data Cleaning chapter)
    map2_df(vulnerability_data, names(vulnerability_data), ~  replace(.x, .x==1, .y) %>%
    replace(. == 0, NA)) %>%
    unite(combined, disability, `60+`, displaced, low_income, unemployed, remove = FALSE, na.rm = TRUE, sep = '&')%>%
    filter(!combined == "")

#calculate weighted summary statistics for each combination
vulnerability_summary <- vulnerability_data %>%
  select(strata, weight, combined)%>%
  group_by(combined) %>%
  summarise(weight_sum = sum(as.numeric(weight)))%>%
  mutate(per = weight_sum / sum(weight_sum) * 100)%>%
  filter(per > 1)%>%
  select(-weight_sum)

#convert data frame into named numeric vector that is used by plot function
vulnerability_input <-  vulnerability_summary %>%
                        deframe()
In this block we will build euler diagram using REACH color palette and some basic styling.
plot(euler(vulnerability_input),
     edges = FALSE,
     quantities = list(type = "percent", fontsize = 8),
     labels = c("60+", "Displaced", "Low income", "Disability", "Unemployed"),
     legend = list(labels = c("60+", "Displaced", "Low income", "Disability", "Unemployed")),
     fills = c("#7CB6C4","#B6C8B1","#F6E3E3","#D1CAB8","#D1D3D4")
     )
As an alternative, we also can build a Venn diagram that shows each relation (even not possible in reality). As you can see Venn diagram in this case is less readable and usable.
plot(venn(vulnerability_input),
edges = FALSE,
quantities = list(type = "percent", fontsize = 8),
labels = c("60+", "Displaced", "Low income", "Disability", "Unemployed"),
legend = list(labels = c("60+", "Displaced", "Low income", "Disability", "Unemployed")),
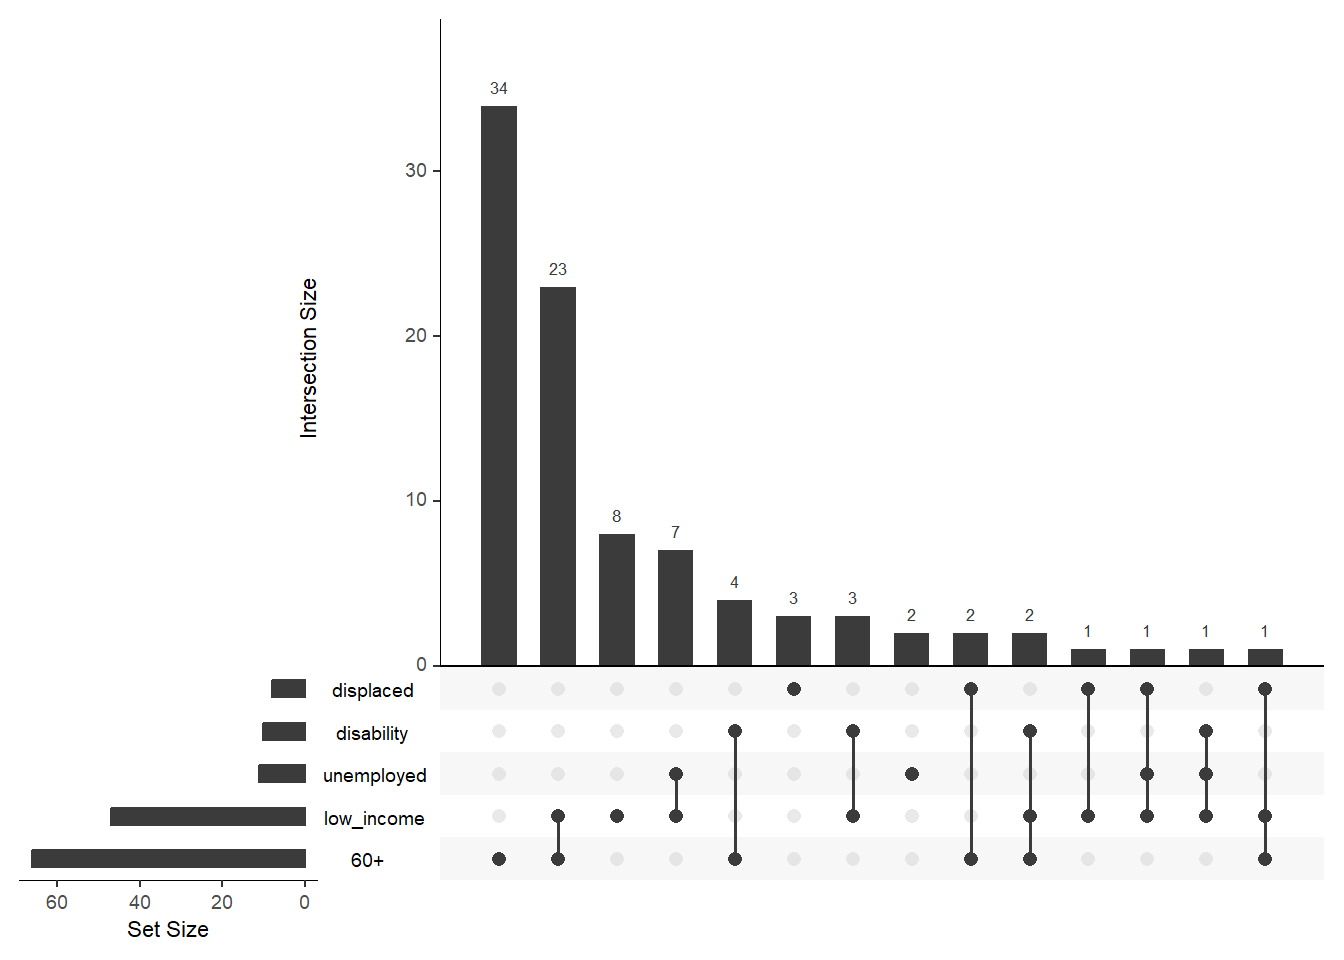
fills = c("#7CB6C4","#B6C8B1","#F6E3E3","#D1CAB8","#D1D3D4"))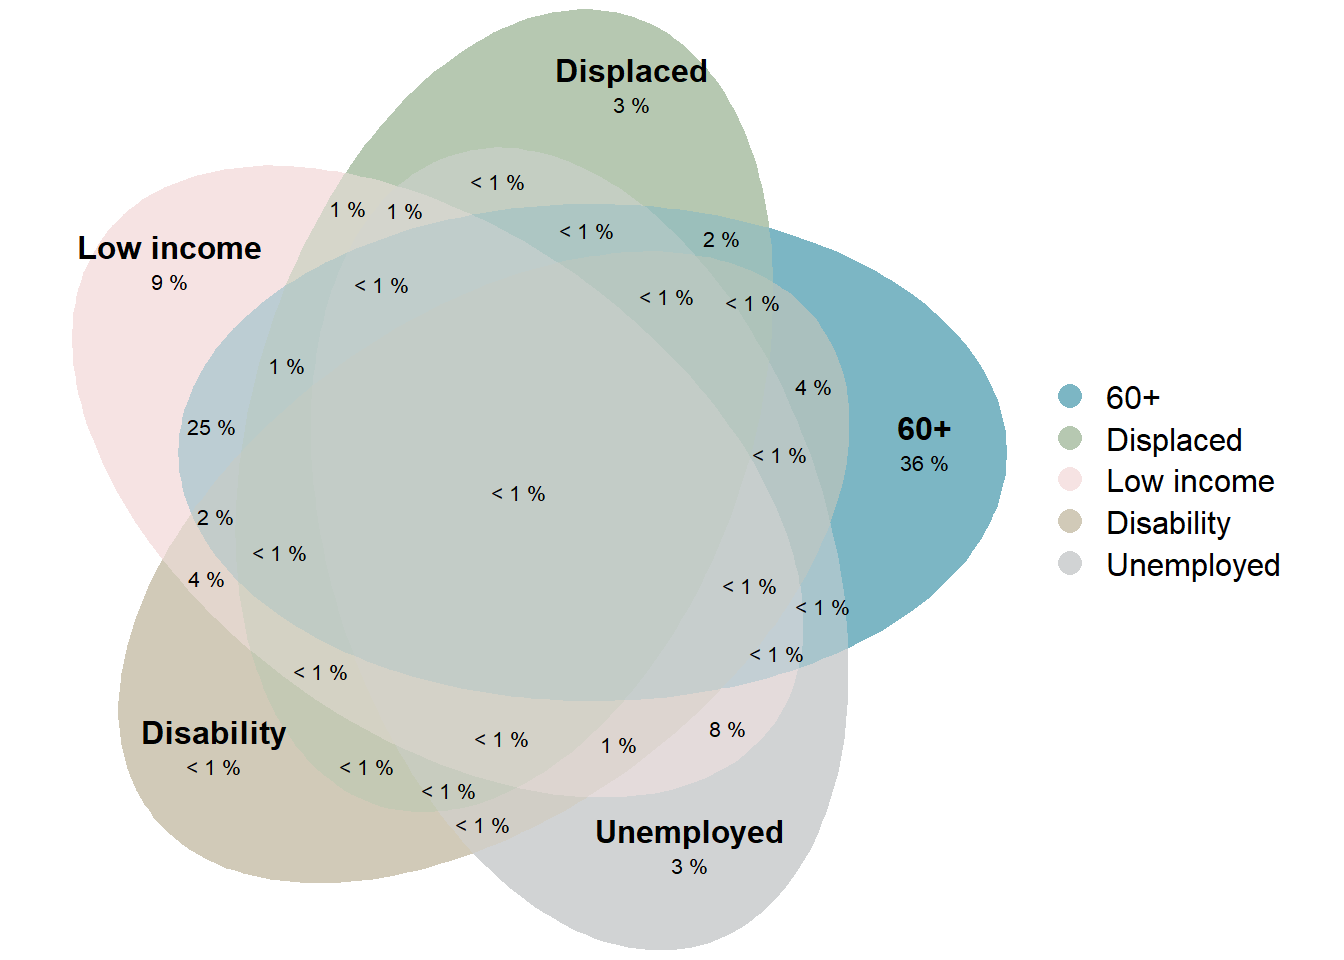 Another popular type of diagram that shows relation is UpSetR diagram. Even with default styling, it’s quite good in the visualization of intersections between different HH characteristics.

8.3.8 Circular barplots
For creating circular barplots, frequency table with selected indicators should be prepared first.
For the current example, let’s create the table on everyday consumption of different kinds of food in a HH depending on the area of living urban/rural
library(dplyr)
library(tidyr)

main_dataset <- separate(main_dataset, strata, into = c("zone", "type"), "_")

dnames <- names(main_dataset)

cons_names <- dnames[grepl("consumption", dnames)]

tidy_names <- c("Cereals", "Roots", "Vegetables", "Fruits", "Meat", "Eggs", "Pulses", "Dairy", "Oil", "Sugar", "Condiments")

table_food <- as.data.frame(matrix(nrow = 0, ncol = 5))

i <- 1
for (i in 1:length(cons_names)) {
ni <- cons_names[i]

rur <- main_dataset |> filter(type == "rural") |> filter(!is.na(ni)) |> count(!!sym(ni)) |> mutate(base = sum(n), prop = round((n/base)*100, 0), group = tidy_names[i], individual = "Rural")

urb <- main_dataset |> filter(type == "urban") |> filter(!is.na(ni)) |> count(!!sym(ni)) |> mutate(base = sum(n), prop = round((n/base)*100, 0), group = tidy_names[i], individual = "Urban")

names(rur) <- c("fre_cons", "n", "base", "prop", "group", "individual")
names(urb) <- c("fre_cons", "n", "base", "prop", "group", "individual")

table_food <- rbind(table_food, rur, urb)
}

table_food$value <- table_food$prop
For the current chart, the everyday consumption of certain products will be selected, so frequency of consumption should be filtered so it is == 7
Adding “filler” field to make the bottom layer (unfilled space) with light grey. Filler should be equal to the “end of the scale”, e.g 100%
Preparing grid data for the chart
table_food$group <- as.factor(table_food$group)
# Set a number of 'empty bar' to add at the end of each group
empty_bar <- 1
to_add <- data.frame( matrix(NA, empty_bar*nlevels(table_food$group), ncol(table_food)))
colnames(to_add) <- colnames(table_food)
to_add$group <- rep(levels(table_food$group), each=empty_bar)
table_food <- rbind(table_food, to_add)
table_food <- table_food %>% arrange(group)
table_food$id <- seq(1, nrow(table_food))

#one more empty bar
to_add <- data.frame( matrix(NA, empty_bar*nlevels(table_food$group), ncol(table_food)))
colnames(to_add) <- colnames(table_food)
to_add$group <- rep(levels(table_food$group), each=empty_bar)
table_food <- rbind(table_food, to_add)
table_food <- table_food %>% arrange(group)
table_food$id <- seq(1, nrow(table_food))

# Get the name and the y position of each label
label_data <- table_food
number_of_bar <- nrow(label_data)

# Subtract 0.5 because the letter must have the angle of the center of the bars. Not extreme right(1) or extreme left (0)
angle <- 90 - 360 * (label_data$id-0.5) / number_of_bar
label_data$hjust <- ifelse(angle <- 85, 1, 0)
label_data$angle <- ifelse(angle <- 85, angle + 180, angle)

# prepare a data frame for base lines
base_data <- table_food %>%
  group_by(group) %>%
  dplyr::summarize(start=min(id), end=max(id) - empty_bar) %>%
  rowwise() %>%
  mutate(title=mean(c(start, end)))

# prepare a data frame for grid (scales)
grid_data <- base_data
grid_data$end <- grid_data$end[ c( nrow(grid_data), 1:nrow(grid_data)-1)] + 1
grid_data$start <- grid_data$start - 1
grid_data <- grid_data[-1,]

# fixing grid data
grid_data$start = grid_data$start - 0.2
grid_data$end = grid_data$end + 0.2

#label color - to put text within bars and placement of the label

label_data$lab_color = "black"
label_data$lab_placement= table_food$value-(table_food$value-1)
Picking the threshold for highlighting a bar in different color. Let’s put <= 10% in red, 11% - 50% in grey an 51% - 100% in green
table_food <- table_food |> mutate(highlight = case_when(table_food$value <= 10 ~ "bad",
                                                         table_food$value >= 11 & table_food$value <= 50 ~ "moderate",
                                                         table_food$value >= 51 ~ "good"))
table_food$highlight = as.factor(table_food$highlight)
8.3.8.1 Adding thermometer visual elemant (if needed)
cat_low = rep("bad", 10)
cat_med = rep("moderate", 41)
cat_high = rep("good", 49)
thermometer = data.frame(cat  = c(cat_low, cat_med, cat_high),
                        number = c(rep(1,100)),
                        pos  = c(rep(1,100)))

thermometer$cat = ordered(thermometer$cat, levels=c("bad", "moderate", "good"))
ball = data.frame(v = 0,
                  h = 1)

ggplot(thermometer)+
geom_col(aes(x = pos, y = number, fill = cat), position = position_stack(reverse = T), width = 0.1)+
xlim(0,2)+
ylim(-5, 105)+
scale_fill_manual(breaks = c('bad', "moderate", "good"), values = c("moderate" = "dimgray", "good" = "seagreen", "bad" = "firebrick"))+
geom_point(data = ball, aes(x = h, y = v-5), color = "firebrick", size = 20)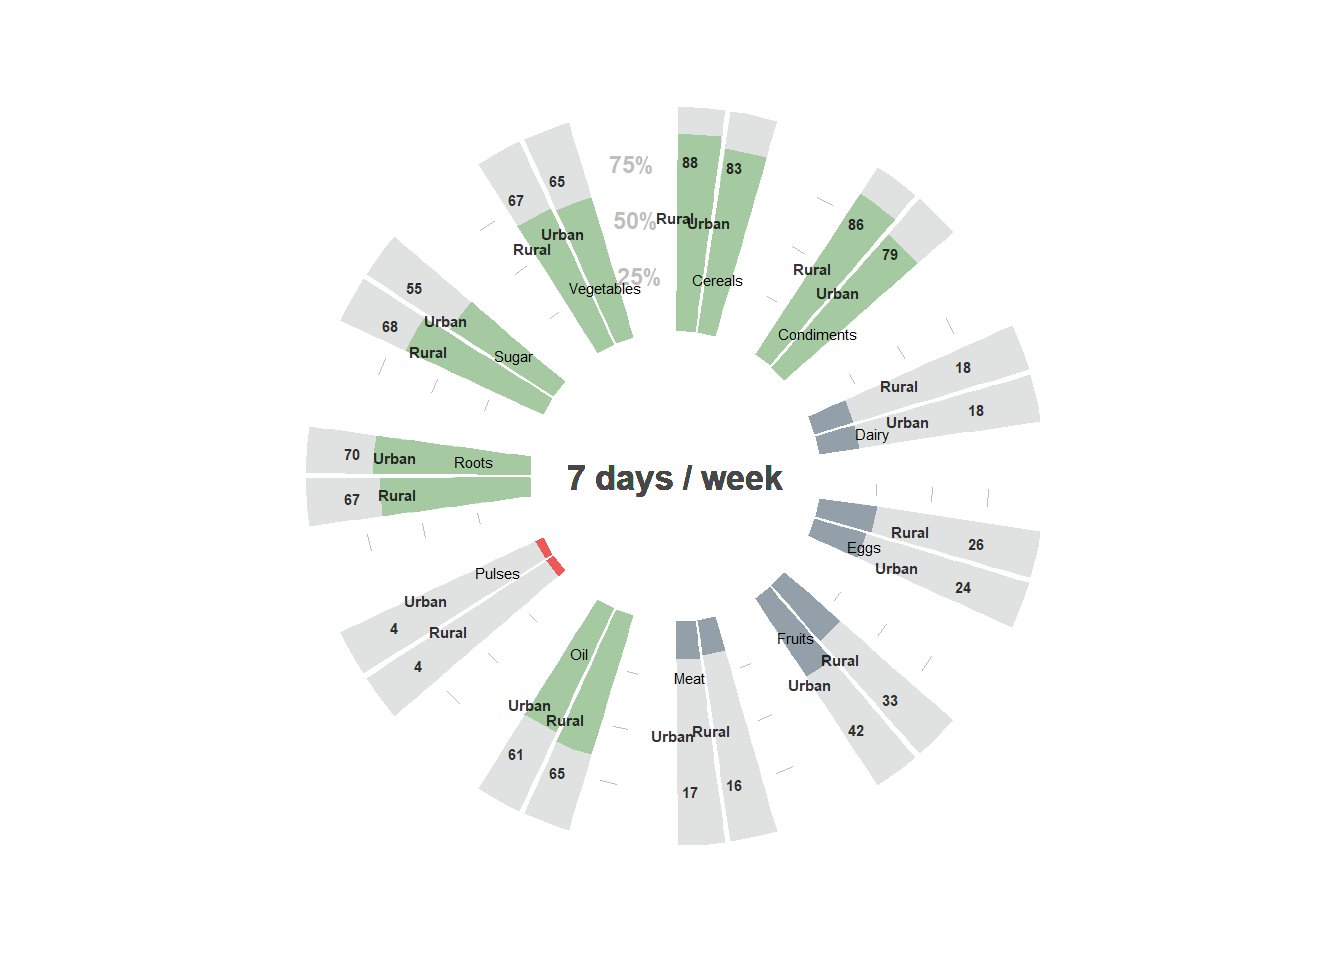
8.3.8.2 Creating the plot itself
p <- ggplot(table_food, aes(x=as.factor(id), y=value), width = 0.3) +
  # Note that id is a factor. If x is numeric, there is some space between the first bar
  # Placing base layer of bars
  geom_bar(aes(x=as.factor(id), y=filler), fill="#E0E2E2", stat="identity", alpha=1) +
  geom_bar(aes(x=as.factor(id), y=value, fill=highlight), stat="identity", alpha=1) +
  scale_fill_manual(breaks = c("moderate", 'good', "bad"), values = c("moderate" = "#93A0A9", "good" = "#A5C9A1", "bad" = "#EE5859")) +
  # Add a val=100/75/50/25 lines. Do it at the beginning to make sure barplots are OVER it.
  geom_segment(data=grid_data, aes(x = end, y = 75, xend = start, yend = 75), colour = "grey", alpha=1, size=0.3 , inherit.aes = FALSE ) +
  geom_segment(data=grid_data, aes(x = end, y = 50, xend = start, yend = 50), colour = "grey", alpha=1, size=0.3 , inherit.aes = FALSE ) +
  geom_segment(data=grid_data, aes(x = end, y = 25, xend = start, yend = 25), colour = "grey", alpha=1, size=0.3 , inherit.aes = FALSE ) +

  theme_minimal(base_family = "Arial") +
  theme(
    legend.position = "none",
    axis.text = element_blank(),
    axis.title = element_blank(),
    panel.grid = element_blank()
  ) +
  coord_polar() +

  # Add text showing the value of each 100/75/50/25 lines
  annotate("text", x = rep(max(table_food$id),3), y = c(25, 50, 75), label = c("25%", "50%", "75%") , color="grey", size=3 , angle=0, fontface="bold", hjust=1) +
  # Labels inside bars
  geom_text(data=label_data, aes(x=id, y=lab_placement+50, label=individual, hjust=hjust, ), color = "black", fontface="bold",alpha=0.8, size=2, inherit.aes = FALSE, family = "Arial Narrow") +
  # Value numbers at the beginning of each bar
  geom_text(data=label_data, aes(x=id, y=lab_placement+75, label=value, hjust=hjust, ), color = "black", fontface="bold",alpha=0.8, size=2, inherit.aes = FALSE, family = "Arial Narrow")+
  # labels of groups
  geom_text(data=base_data, aes(x = title, y = 25, label=group), size = 2, inherit.aes = FALSE)
## Warning: Using `size` aesthetic for lines was deprecated in ggplot2
## 3.4.0.
## ℹ Please use `linewidth` instead.## Warning: Removed 22 rows containing missing values
## (`position_stack()`).## Warning: Removed 22 rows containing missing values
## (`position_stack()`).## Warning: Removed 22 rows containing missing values (`geom_text()`).
## Removed 22 rows containing missing values (`geom_text()`).## Warning in grid.Call.graphics(C_text, as.graphicsAnnot(x$label), x$x, x$y, :
## font family not found in Windows font database
8.3.8.3 Adding a text in the center of the plot
p + geom_text(x = 0, aes(y = -65, label = "7 days / week"), size = 4.5, fontface = "bold", family = "Arial Narrow", color = "gray28")## Warning: Removed 22 rows containing missing values
## (`position_stack()`).
## Removed 22 rows containing missing values
## (`position_stack()`).## Warning: Removed 22 rows containing missing values (`geom_text()`).
## Removed 22 rows containing missing values (`geom_text()`).## Warning in grid.Call.graphics(C_text, as.graphicsAnnot(x$label), x$x, x$y, :
## font family not found in Windows font database
## Warning in grid.Call.graphics(C_text, as.graphicsAnnot(x$label), x$x, x$y, :
## font family not found in Windows font database
8.3.8.4 Adding a thermometer object to the plot
p + geom_col(data = thermometer, aes(x = 43.5, y = number, fill = cat), position = position_stack(reverse = T), width = 0.3, angle = 0)+
geom_point(data = ball, aes(x = 43.5, y = v-2), color = "#EE5859", size = 5)+
geom_text(aes(x = 42.8, y = 5, label = "Freq. of consumption"), color = "black", fontface="bold",alpha=0.6, size=2.3, angle= 100, hjust = 0, family = "Arial Narrow")## Warning in geom_col(data = thermometer, aes(x = 43.5, y = number, fill = cat), :
## Ignoring unknown parameters: `angle`## Warning: Removed 22 rows containing missing values
## (`position_stack()`).
## Removed 22 rows containing missing values
## (`position_stack()`).## Warning: Removed 22 rows containing missing values (`geom_text()`).
## Removed 22 rows containing missing values (`geom_text()`).## Warning in grid.Call.graphics(C_text, as.graphicsAnnot(x$label), x$x, x$y, :
## font family not found in Windows font database
## Warning in grid.Call.graphics(C_text, as.graphicsAnnot(x$label), x$x, x$y, :
## font family not found in Windows font database

## Warning in grid.Call.graphics(C_text, as.graphicsAnnot(x$label), x$x, x$y, :
## font family not found in Windows font database
## Warning in grid.Call.graphics(C_text, as.graphicsAnnot(x$label), x$x, x$y, :
## font family not found in Windows font database
## Warning in grid.Call.graphics(C_text, as.graphicsAnnot(x$label), x$x, x$y, :
## font family not found in Windows font database
## Warning in grid.Call.graphics(C_text, as.graphicsAnnot(x$label), x$x, x$y, :
## font family not found in Windows font database
## Warning in grid.Call.graphics(C_text, as.graphicsAnnot(x$label), x$x, x$y, :
## font family not found in Windows font database
## Warning in grid.Call.graphics(C_text, as.graphicsAnnot(x$label), x$x, x$y, :
## font family not found in Windows font database
## Warning in grid.Call.graphics(C_text, as.graphicsAnnot(x$label), x$x, x$y, :
## font family not found in Windows font database
## Warning in grid.Call.graphics(C_text, as.graphicsAnnot(x$label), x$x, x$y, :
## font family not found in Windows font database
## Warning in grid.Call.graphics(C_text, as.graphicsAnnot(x$label), x$x, x$y, :
## font family not found in Windows font database
## Warning in grid.Call.graphics(C_text, as.graphicsAnnot(x$label), x$x, x$y, :
## font family not found in Windows font database
## Warning in grid.Call.graphics(C_text, as.graphicsAnnot(x$label), x$x, x$y, :
## font family not found in Windows font database
## Warning in grid.Call.graphics(C_text, as.graphicsAnnot(x$label), x$x, x$y, :
## font family not found in Windows font database
## Warning in grid.Call.graphics(C_text, as.graphicsAnnot(x$label), x$x, x$y, :
## font family not found in Windows font database
## Warning in grid.Call.graphics(C_text, as.graphicsAnnot(x$label), x$x, x$y, :
## font family not found in Windows font database
## Warning in grid.Call.graphics(C_text, as.graphicsAnnot(x$label), x$x, x$y, :
## font family not found in Windows font database
## Warning in grid.Call.graphics(C_text, as.graphicsAnnot(x$label), x$x, x$y, :
## font family not found in Windows font database
## Warning in grid.Call.graphics(C_text, as.graphicsAnnot(x$label), x$x, x$y, :
## font family not found in Windows font database
## Warning in grid.Call.graphics(C_text, as.graphicsAnnot(x$label), x$x, x$y, :
## font family not found in Windows font database
## Warning in grid.Call.graphics(C_text, as.graphicsAnnot(x$label), x$x, x$y, :
## font family not found in Windows font database
## Warning in grid.Call.graphics(C_text, as.graphicsAnnot(x$label), x$x, x$y, :
## font family not found in Windows font database
## Warning in grid.Call.graphics(C_text, as.graphicsAnnot(x$label), x$x, x$y, :
## font family not found in Windows font database
## Warning in grid.Call.graphics(C_text, as.graphicsAnnot(x$label), x$x, x$y, :
## font family not found in Windows font database
## Warning in grid.Call.graphics(C_text, as.graphicsAnnot(x$label), x$x, x$y, :
## font family not found in Windows font database
## Warning in grid.Call.graphics(C_text, as.graphicsAnnot(x$label), x$x, x$y, :
## font family not found in Windows font database
## Warning in grid.Call.graphics(C_text, as.graphicsAnnot(x$label), x$x, x$y, :
## font family not found in Windows font database
## Warning in grid.Call.graphics(C_text, as.graphicsAnnot(x$label), x$x, x$y, :
## font family not found in Windows font database
## Warning in grid.Call.graphics(C_text, as.graphicsAnnot(x$label), x$x, x$y, :
## font family not found in Windows font database
## Warning in grid.Call.graphics(C_text, as.graphicsAnnot(x$label), x$x, x$y, :
## font family not found in Windows font database
## Warning in grid.Call.graphics(C_text, as.graphicsAnnot(x$label), x$x, x$y, :
## font family not found in Windows font database
## Warning in grid.Call.graphics(C_text, as.graphicsAnnot(x$label), x$x, x$y, :
## font family not found in Windows font database
## Warning in grid.Call.graphics(C_text, as.graphicsAnnot(x$label), x$x, x$y, :
## font family not found in Windows font database
## Warning in grid.Call.graphics(C_text, as.graphicsAnnot(x$label), x$x, x$y, :
## font family not found in Windows font database
## Warning in grid.Call.graphics(C_text, as.graphicsAnnot(x$label), x$x, x$y, :
## font family not found in Windows font database
## Warning in grid.Call.graphics(C_text, as.graphicsAnnot(x$label), x$x, x$y, :
## font family not found in Windows font database
## Warning in grid.Call.graphics(C_text, as.graphicsAnnot(x$label), x$x, x$y, :
## font family not found in Windows font database
## Warning in grid.Call.graphics(C_text, as.graphicsAnnot(x$label), x$x, x$y, :
## font family not found in Windows font database
## Warning in grid.Call.graphics(C_text, as.graphicsAnnot(x$label), x$x, x$y, :
## font family not found in Windows font database
## Warning in grid.Call.graphics(C_text, as.graphicsAnnot(x$label), x$x, x$y, :
## font family not found in Windows font database
## Warning in grid.Call.graphics(C_text, as.graphicsAnnot(x$label), x$x, x$y, :
## font family not found in Windows font database
## Warning in grid.Call.graphics(C_text, as.graphicsAnnot(x$label), x$x, x$y, :
## font family not found in Windows font database
## Warning in grid.Call.graphics(C_text, as.graphicsAnnot(x$label), x$x, x$y, :
## font family not found in Windows font database
## Warning in grid.Call.graphics(C_text, as.graphicsAnnot(x$label), x$x, x$y, :
## font family not found in Windows font database
## Warning in grid.Call.graphics(C_text, as.graphicsAnnot(x$label), x$x, x$y, :
## font family not found in Windows font database
## Warning in grid.Call.graphics(C_text, as.graphicsAnnot(x$label), x$x, x$y, :
## font family not found in Windows font database
## Warning in grid.Call.graphics(C_text, as.graphicsAnnot(x$label), x$x, x$y, :
## font family not found in Windows font database
## Warning in grid.Call.graphics(C_text, as.graphicsAnnot(x$label), x$x, x$y, :
## font family not found in Windows font database
## Warning in grid.Call.graphics(C_text, as.graphicsAnnot(x$label), x$x, x$y, :
## font family not found in Windows font database
## Warning in grid.Call.graphics(C_text, as.graphicsAnnot(x$label), x$x, x$y, :
## font family not found in Windows font database
## Warning in grid.Call.graphics(C_text, as.graphicsAnnot(x$label), x$x, x$y, :
## font family not found in Windows font database
## Warning in grid.Call.graphics(C_text, as.graphicsAnnot(x$label), x$x, x$y, :
## font family not found in Windows font database
## Warning in grid.Call.graphics(C_text, as.graphicsAnnot(x$label), x$x, x$y, :
## font family not found in Windows font database
## Warning in grid.Call.graphics(C_text, as.graphicsAnnot(x$label), x$x, x$y, :
## font family not found in Windows font database
## Warning in grid.Call.graphics(C_text, as.graphicsAnnot(x$label), x$x, x$y, :
## font family not found in Windows font database
## Warning in grid.Call.graphics(C_text, as.graphicsAnnot(x$label), x$x, x$y, :
## font family not found in Windows font database
## Warning in grid.Call.graphics(C_text, as.graphicsAnnot(x$label), x$x, x$y, :
## font family not found in Windows font database
## Warning in grid.Call.graphics(C_text, as.graphicsAnnot(x$label), x$x, x$y, :
## font family not found in Windows font database
## Warning in grid.Call.graphics(C_text, as.graphicsAnnot(x$label), x$x, x$y, :
## font family not found in Windows font database
## Warning in grid.Call.graphics(C_text, as.graphicsAnnot(x$label), x$x, x$y, :
## font family not found in Windows font database
## Warning in grid.Call.graphics(C_text, as.graphicsAnnot(x$label), x$x, x$y, :
## font family not found in Windows font database
## Warning in grid.Call.graphics(C_text, as.graphicsAnnot(x$label), x$x, x$y, :
## font family not found in Windows font database
## Warning in grid.Call.graphics(C_text, as.graphicsAnnot(x$label), x$x, x$y, :
## font family not found in Windows font database
## Warning in grid.Call.graphics(C_text, as.graphicsAnnot(x$label), x$x, x$y, :
## font family not found in Windows font database
## Warning in grid.Call.graphics(C_text, as.graphicsAnnot(x$label), x$x, x$y, :
## font family not found in Windows font database
## Warning in grid.Call.graphics(C_text, as.graphicsAnnot(x$label), x$x, x$y, :
## font family not found in Windows font database
## Warning in grid.Call.graphics(C_text, as.graphicsAnnot(x$label), x$x, x$y, :
## font family not found in Windows font database
## Warning in grid.Call.graphics(C_text, as.graphicsAnnot(x$label), x$x, x$y, :
## font family not found in Windows font database
## Warning in grid.Call.graphics(C_text, as.graphicsAnnot(x$label), x$x, x$y, :
## font family not found in Windows font database
## Warning in grid.Call.graphics(C_text, as.graphicsAnnot(x$label), x$x, x$y, :
## font family not found in Windows font database
## Warning in grid.Call.graphics(C_text, as.graphicsAnnot(x$label), x$x, x$y, :
## font family not found in Windows font database
## Warning in grid.Call.graphics(C_text, as.graphicsAnnot(x$label), x$x, x$y, :
## font family not found in Windows font database
## Warning in grid.Call.graphics(C_text, as.graphicsAnnot(x$label), x$x, x$y, :
## font family not found in Windows font database
## Warning in grid.Call.graphics(C_text, as.graphicsAnnot(x$label), x$x, x$y, :
## font family not found in Windows font database
## Warning in grid.Call.graphics(C_text, as.graphicsAnnot(x$label), x$x, x$y, :
## font family not found in Windows font database
## Warning in grid.Call.graphics(C_text, as.graphicsAnnot(x$label), x$x, x$y, :
## font family not found in Windows font database
## Warning in grid.Call.graphics(C_text, as.graphicsAnnot(x$label), x$x, x$y, :
## font family not found in Windows font database
## Warning in grid.Call.graphics(C_text, as.graphicsAnnot(x$label), x$x, x$y, :
## font family not found in Windows font database
## Warning in grid.Call.graphics(C_text, as.graphicsAnnot(x$label), x$x, x$y, :
## font family not found in Windows font database
## Warning in grid.Call.graphics(C_text, as.graphicsAnnot(x$label), x$x, x$y, :
## font family not found in Windows font database
## Warning in grid.Call.graphics(C_text, as.graphicsAnnot(x$label), x$x, x$y, :
## font family not found in Windows font database
## Warning in grid.Call.graphics(C_text, as.graphicsAnnot(x$label), x$x, x$y, :
## font family not found in Windows font database
## Warning in grid.Call.graphics(C_text, as.graphicsAnnot(x$label), x$x, x$y, :
## font family not found in Windows font database
## Warning in grid.Call.graphics(C_text, as.graphicsAnnot(x$label), x$x, x$y, :
## font family not found in Windows font database
## Warning in grid.Call.graphics(C_text, as.graphicsAnnot(x$label), x$x, x$y, :
## font family not found in Windows font database
## Warning in grid.Call.graphics(C_text, as.graphicsAnnot(x$label), x$x, x$y, :
## font family not found in Windows font database
## Warning in grid.Call.graphics(C_text, as.graphicsAnnot(x$label), x$x, x$y, :
## font family not found in Windows font database
## Warning in grid.Call.graphics(C_text, as.graphicsAnnot(x$label), x$x, x$y, :
## font family not found in Windows font database
## Warning in grid.Call.graphics(C_text, as.graphicsAnnot(x$label), x$x, x$y, :
## font family not found in Windows font database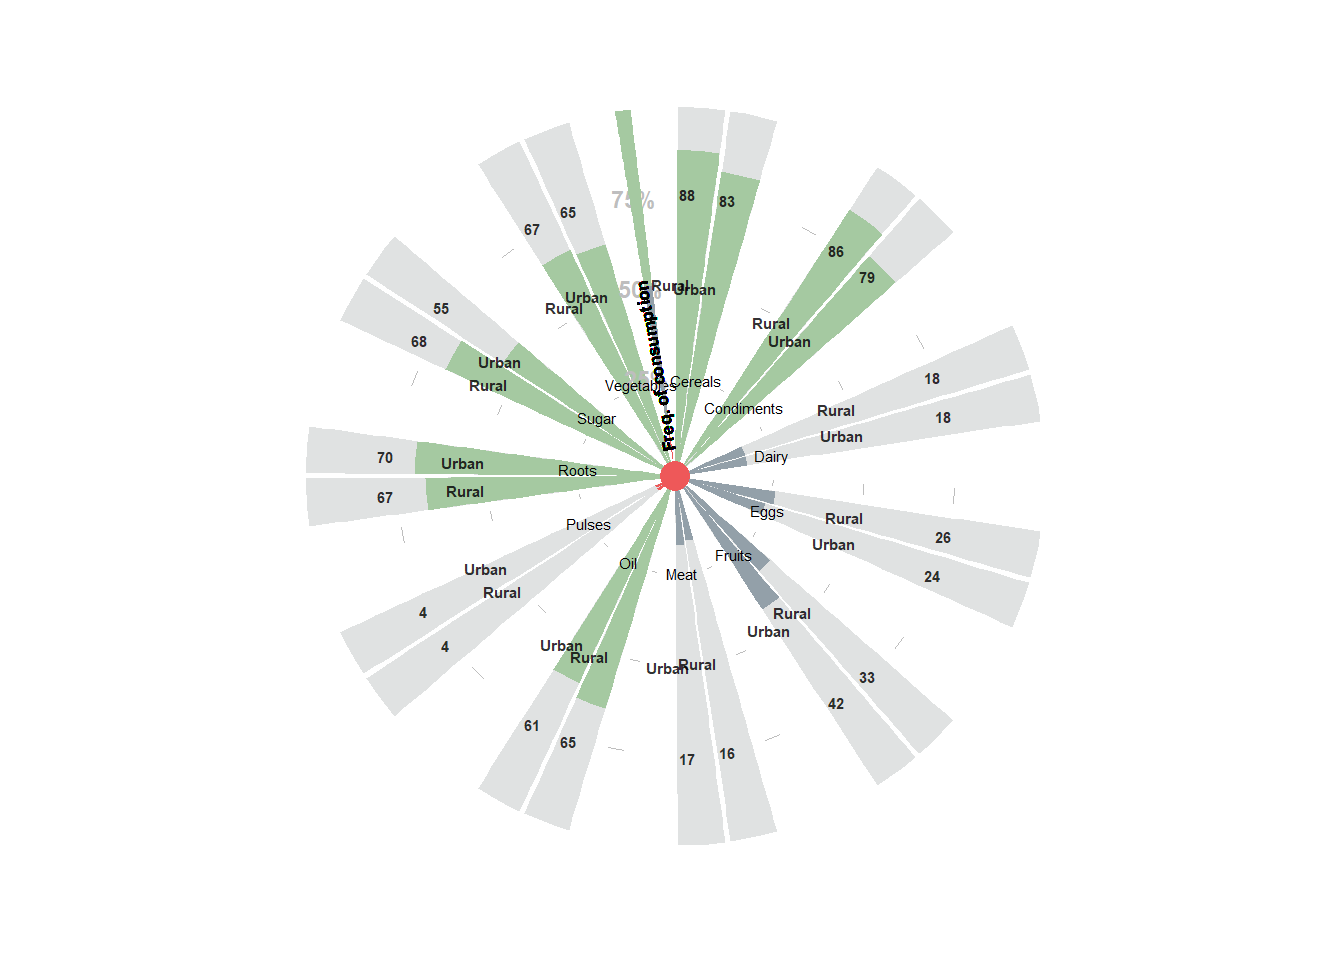
8.4 Labels
8.4.1 Xml to Label
The following code transform column headers, select_one and select_multiple values from XML to Label.
Loading Libraries
Dataset column headers function
xml2label_question <- function(tool_survey, tool_choices, col){
  # for each column check if it is a select multiple
  if (str_detect(col, "/")) {
    q.name <- str_split(col, "/")[[1]][1]
    c.name <- paste0(tail(str_split(col, "/")[[1]], -1), collapse="/")
  } else {
    q.name <- col
    c.name <- NA
  }

  # returning the label and make sure to include the label of multiple choices after /
  if (q.name %in% tool_survey$name){
    q <- tool_survey[tool_survey$name==q.name,]
    q.label <- q$`label::english`
    if (is.na(q.label) | q$type %in% c("note")) q.label <- q.name
    if (!is.na(c.name)){
      q.list_name=ifelse(q$list_name=="NA", NA, q$list_name)
      c.label <- tool_choices[tool_choices$list_name==q.list_name & tool_choices$name==c.name, "label::english"]
    } else c.label <- NA
    label <- ifelse(is.na(c.label), q.label, paste0(q.label, "/", c.label))
  } else label <- q.name
  return(label)
}
Select_one values function
xml2label_choices_one <- function(tool_survey, tool_choices, data, col) {
  # select the type column from each select_one question
  q.type <- tool_survey$type[tool_survey$name==col]

  # take the id of the choices to get the list name
  q.list_name <- str_split(q.type, " ")[[1]][2]

  # export the choices relevant to each select_one question
  choices <- tool_choices %>% filter(list_name == q.list_name) %>%
      select(name, `label::english`) %>% rename(label=`label::english`)

  # replace the xml with label using left_join
  d.join <- data.frame(col=as.character(data[[col]])) %>%
    left_join(choices, by=c("col"="name")) %>% select(label)

  # return only the new label column and replace it in the for loop using vectors
  return(d.join$label)
}
Select_multiple values function
xml2label_choices_multiple <- function(tool_survey, tool_choices, data, col) {
  # select all the columns with all the options for each select_multiple
  d.join <- data %>%
    select(contains(paste0(col,"/")))
  col_internal <- colnames(d.join)

  # for each column with options
  for(j in 1:length(col_internal)){
    # change all 1's to the xml answer
    xml_answer <- str_split(col_internal[j], "/")[[1]][2]
    d.join <- d.join %>%
      mutate(!!sym(col_internal[j]) := ifelse(!!sym(col_internal[j]) == "1", xml_answer, NA))

    # get the list of the xml and label options for each select multiple questions
    choice_id <- filter(tool_survey, str_starts(name, str_split(col_internal[j],"/")[[1]][1])) %>%
      select(list_name)
    choice_id <- choice_id$list_name
    t.choices <- tool_choices %>%
      filter(list_name == choice_id) %>%
      select(name, `label::english`) %>% rename(label = `label::english`)

    # replace the xml with label using left_join
    d.new.join <- data.frame(col=as.character(d.join[[col_internal[j]]])) %>%
      left_join(t.choices, by=c("col"="name")) %>% select(label)
    d.join[col_internal[j]] <- d.new.join$label
  }

  # concatenate all the answers, removing NAs in one cell and separated by a ';'
  d.join <- d.join %>%
    unite("Merged", everything(), sep= ";", na.rm = T)

  # return only the new label column and replace it in the for loop using vectors
  return(d.join$Merged)
}
Example
filename_tool <- "enter your tool link here"
filename_cleaned_data <- "enter your data hear"

# loading tool
tool_survey <- read_excel(filename_tool, sheet = "survey", col_types = "text") %>%
  filter(!is.na(name)) %>%
  # adding two columns showing the question type and the id of the list_name choices separately
  mutate(q.type = as.character(lapply(type, function(x) str_split(x, " ")[[1]][1])),
         list_name = as.character(lapply(type, function(x) str_split(x, " ")[[1]][2])))

tool_choices <- read_excel(filename_tool, sheet = "choices", col_types = "text") %>%
  filter(!is.na(list_name))


# loading the data
main_dataset <- read_excel(filename_cleaned_data, col_types = "text")

# creating another data frame with changes

data_labeled <- main_dataset

# select_one values - XML to Label

tool_select_one <- tool_survey %>%
  filter(str_starts(type, "select_one "))

col_select_one <- tool_select_one$name

for (i in 1:length(col_select_one)){
  if(!is.null(data_labeled[[col_select_one[i]]])){
    data_labeled[[col_select_one[i]]] <- xml2label_choices_one(tool_survey,tool_choices,main_dataset,col_select_one[i])
  }
}

# select_multiple values - XML to Label

tool_select_multi <- tool_survey %>%
  filter(str_starts(type, "select_multiple "))
col_select_multi <- tool_select_multi$name

for (i in 1:length(col_select_multi)){
  if(!is.null(data_labeled[[col_select_multi[i]]])){
    data_labeled[[col_select_multi[i]]] <- xml2label_choices_multiple(tool_survey,tool_choices,main_dataset,col_select_multi[i])
  }
}

# Column headers - XML to Label
col_names <- colnames(main_dataset)

for (i in 1:length(col_names)) {
  colnames(data_labeled)[i] <- xml2label_question(tool_survey, tool_choices, col_names[i])

}
8.4.2 change from label to xml
The following code transform column headers, select_one and select_multiple values from Label to XML.
Conditions required for the code to function correctly: 1- The “label::English” column in KOBO Tool must contain unique values. 2- The labeled data should be saved in the Excel file format. 3- When selecting options for select_multiple questions, ensure to determine if the options are separated by a forward slash (“/”) or (“.”).
Loading Libraries
Dataset column headers function
label2xml_question <- function(tool_survey, tool_choices, label_colname = "label::English", col, sm_separator = "/"){

  # for each column check if it is a select multiple
  if (str_detect(col, sm_separator)) {
    q.label <- str_split(col, sm_separator)[[1]][1]
    c.label <- paste0(tail(str_split(col, sm_separator)[[1]], -1), collapse=sm_separator)
  } else {
    q.label <- col
    c.label <- NA
  }

  # returning the xml and make sure to include the xml of multiple choices after sm_separator
  if (q.label %in% tool_survey[[label_colname]]){
    q <- tool_survey[tool_survey[[label_colname]] %in% q.label, ]
    q.name <- q$name
    if (is.na(q.name) | q$type %in% c("note")) q.name <- q.label
    if (!is.na(c.label)){
      q.list_name = ifelse(q$list_name == "NA", NA, q$list_name)
      c.name <- tool_choices[tool_choices$list_name %in% q.list_name & tool_choices[[label_colname]]%in% c.label, "name"]
    } else c.name <- NA
    name <- ifelse(is.na(c.name), q.name, paste0(q.name, sm_separator, c.name))
  } else name <- q.label
  return(name)
}
Select_one values function
label2xml_choices_one <- function(tool_survey, tool_choices, label_colname = "label::English", data, col) {

  # select the type column from each select_one question
  q.type <- tool_survey$type[tool_survey[[label_colname]] %in% col]

  # take the id of the choices to get the list name
  q.list_name <- str_split(q.type, " ")[[1]][2]

  # export the choices relevant to each select_one question
  choices <- tool_choices %>% filter(list_name == q.list_name) %>%
    select(name, !!sym(label_colname)) %>% rename(label=label_colname)

  # replace the label with xml using left_join
  d.join <- data.frame(col = as.character(data[[col]])) %>%
    left_join(choices, by = c("col"="label")) %>% select(name)

  # return only the new name column and replace it in the for loop using vectors
  return(d.join$name)
}
Select_multiple values function
label2xml_choices_multiple <- function(tool_survey, tool_choices, data, label_colname = "label::English", col, sm_separator = "/") {

  # select all the columns with all the options for each select_multiple
  d.join <- data %>%
    select(contains(paste0(col, sm_separator)))
  col_internal <- colnames(d.join)

  # for each column with options
  for(j in 1:length(col_internal)){

    # change all 1's to the label answer
    label_answer <- str_split(col_internal[j], sm_separator)[[1]][2]
    d.join <- d.join %>%
      mutate(!!sym(col_internal[j]) := ifelse(!!sym(col_internal[j]) == "1", label_answer, NA))

    # get the list of the label and xml options for each select multiple questions
    choice_id <- tool_survey %>%
      filter(!!sym(label_colname) %in% str_split(col_internal[j], sm_separator)[[1]][1]) %>%
      select(list_name)
    choice_id <- choice_id$list_name
    t.choices <- tool_choices %>%
      filter(list_name == choice_id) %>%
      select(name, !!sym(label_colname)) %>% rename(label = label_colname)

    # replace the label with xml using left_join
    d.new.join <- data.frame(col = as.character(d.join[[col_internal[j]]])) %>%
      left_join(t.choices, by=c("col"="label")) %>% select(name)
    d.join[col_internal[j]] <- d.new.join$name
  }

  # concatenate all the answers, removing NAs in one cell and separated by a ';'
  d.join <- d.join %>%
    unite("Merged", everything(), sep= ";", na.rm = T)

  # return only the new xml column and replace it in the for loop using vectors
  return(d.join$Merged)
}
Example
# input parameters
filename_tool <- "enter your tool here"
filename_labeled_data <- "enter your data here"
label_colname <- "label::English"
sm_separator <- "/"

# loading tool
tool_survey <- read_excel(filename_tool, sheet = "survey", col_types = "text") %>%
  filter(!is.na(name)) %>%
  # adding two columns showing the question type and the id of the list_name choices separately
  mutate(q.type = as.character(lapply(type, function(x) str_split(x, " ")[[1]][1])),
         list_name = as.character(lapply(type, function(x) str_split(x, " ")[[1]][2])))

tool_choices <- read_excel(filename_tool, sheet = "choices", col_types = "text") %>%
  filter(!is.na(list_name))

# loading your dataset with labels
data_labeled <- read_excel(filename_labeled_data, col_types = "text")

# creating another data frame with changes
data_xml <- data_labeled

# select_one values - Label to XML
tool_select_one <- tool_survey %>%
  filter(str_starts(type, "select_one "))

col_select_one <- tool_select_one[[label_colname]]

for (i in 1:length(col_select_one)){
  if(!is.null(data_xml[[col_select_one[i]]])){
    data_xml[[col_select_one[i]]] <- label2xml_choices_one(tool_survey, tool_choices, label_colname,  data = data_labeled, col = col_select_one[i])
  }
}

# select_multiple values - Label to XML
tool_select_multiple <- tool_survey %>%
  filter(str_starts(type, "select_multiple "))
col_select_multiple <- tool_select_multiple[[label_colname]]

for (i in 1:length(col_select_multiple)){
  if(!is.null(data_xml[[col_select_multiple[i]]])){
    data_xml[[col_select_multiple[i]]] <- label2xml_choices_multiple(tool_survey, tool_choices, label_colname,
                                                                     data = data_labeled, col = col_select_multiple[i], sm_separator)
  }
}

# Column headers - Label to XML
col_label <- colnames(data_labeled)

for (i in 1:length(col_label)) {
  colnames(data_xml)[i] <- label2xml_question(tool_survey, tool_choices, label_colname, col = col_label[i], sm_separator)
}